Overview
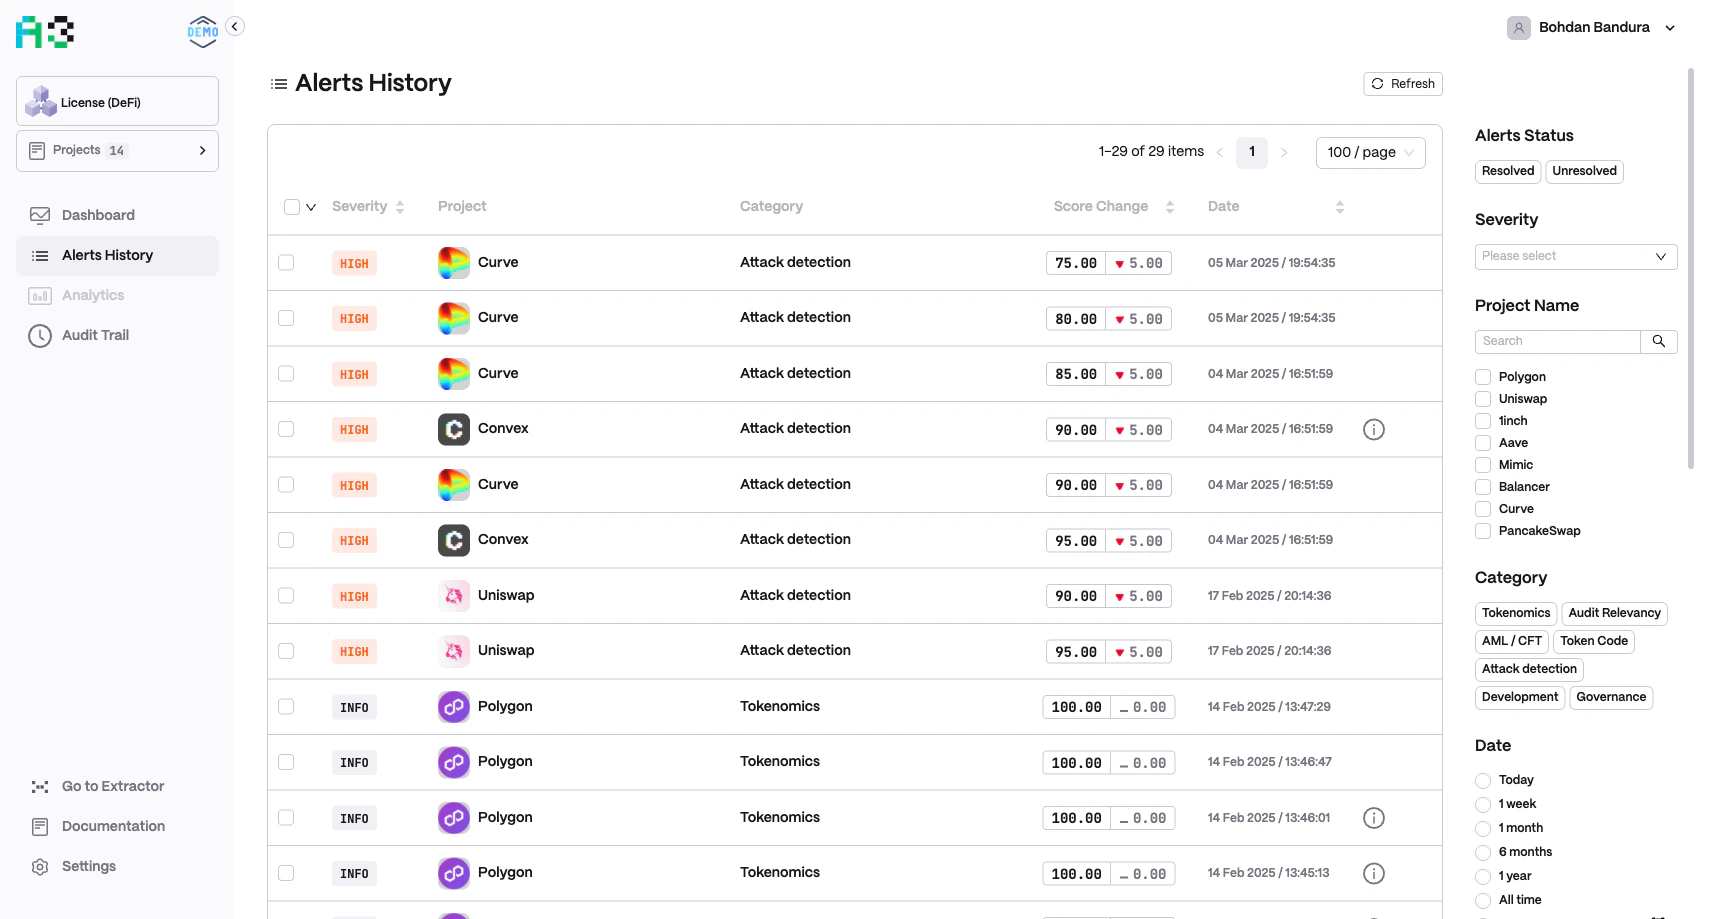
Navigate to Alerts History in the left sidebar to access the full alert log. The table shows up to 10,000 items and paginates at 100 per page by default (adjustable). Click Refresh to reload the latest data.Alert Table
Each row contains:
Click any row to open the Alert Details panel.
Alert Details
The slide-over panel shows the full context of a single alert:- Alert name — descriptive name of the rule that fired (e.g.
AAVE TVL (<45.5B), 10%) - Context value — human-readable metric snapshot (e.g.
TVL: $19.68B / $10.29B / $9.38B, or a transaction hash) - Date and time — exact timestamp
- Severity — badge label
- Score Change — before → after values
- Alert status —
UNRESOLVED(orange) orRESOLVED(green) - Raw data — key/value pairs of the underlying on-chain data that triggered the rule
Use Previous / Next in the panel header to step through adjacent alerts without closing the panel.
For full details on resolving alerts — individually, in bulk, and from other pages — see Resolving Alerts.
Filters
The right-hand sidebar applies filters instantly to the table.Alert Status
Toggle between Resolved and Unresolved alerts.Severity
Filter by severity level: Low, Medium, High, or Critical.Project Name
Search box and checkbox list to filter by one or more projects.Category
Filter by risk or compliance category. The available categories match those configured for your organization. Common examples:- Web3 Security · AML/CFT · Financial Anomaly · Operational Security · Sentiment · Governance (standard DeFi)
- Security · Compliance · Financial · Policy (regulatory monitoring)
- Per-asset categories (ETH, BTC, SOL, etc.) (asset monitoring orgs)
Date
Predefined ranges or a custom date picker:- Today · 1 week · 1 month · 6 months · 1 year · All time · Custom date range